1Introduction
Every quarter, executives of public companies stand before analysts and issue forward-looking statements: revenue targets, margin expectations, product timelines, and directional commentary about the business. These statements move prices, anchor analyst models, and shape investor expectations. Yet the market's institutional memory for whether those statements come true is remarkably short. Guidance is graded informally — a beat here, a miss there — but rarely audited comprehensively across thousands of firms and tens of thousands of individual claims.
This paper asks a simple question at an uncommon scale: when management tells you what will happen, how often does it actually happen? Historically, answering this question required prohibitive manual effort, since guidance is embedded in unstructured conversational text and expressed with wildly varying precision — from “EPS of $2.10 to $2.20” to “we expect continued momentum in the back half.” Modern LLMs make it feasible to extract, classify, and grade these statements at corpus scale.
We contribute three things. First, a census of guidance behavior: how much guidance firms issue, in what form, and about which metrics, across a full fiscal year of transcripts. Second, an accuracy scorecard sliced by quarter, metric, statement precision, direction, and sector. Third, a company-level credibility analysis identifying firms that consistently deliver on guidance versus those that consistently do not — a dimension of management quality that is directly relevant to valuation work, where guidance often seeds forecast assumptions in DCF and comparable-company models.
2Data and Methodology
2.1Corpus
The corpus consists of 3,166 quarterly earnings call transcripts for FY2016, sourced via the Financial Modeling Prep (FMP) API and covering NYSE- and NASDAQ-listed companies across 11 GICS-style sectors. Coverage is roughly balanced across the fiscal year: 783 transcripts in Q1, 786 in Q2, 800 in Q3, and 797 in Q4. FY2016 was selected deliberately: it is recent enough for reliable data coverage, yet old enough that every guidance horizon in the corpus has fully resolved, allowing outcomes to be verified against actual reported results rather than estimates.
2.2Extraction and Verification Pipeline
Each transcript was processed by an LLM-based pipeline (Anthropic Claude, batch API) in two stages. Stage one (extraction) identifies every forward-looking statement made by management and structures it into a guidance item with fields for metric category (revenue, EPS, margins, EBITDA, net income, growth rate, or other), direction (growth, decline, stable/flat, ranges, specific targets), confidence type (explicit — quantified figures or ranges — versus qualitative — directional commentary), and the forecast period. Stage two (verification) compares each item against subsequently reported fundamentals and assigns one of five verdicts:
| Verdict | Definition | Count | Share |
|---|---|---|---|
| ACCURATE | Realized outcome consistent with the guidance | 2,548 | 7.9% |
| PARTIAL | Outcome partially consistent (e.g., direction right, magnitude off) | 525 | 1.6% |
| INACCURATE | Realized outcome contradicts the guidance | 1,299 | 4.0% |
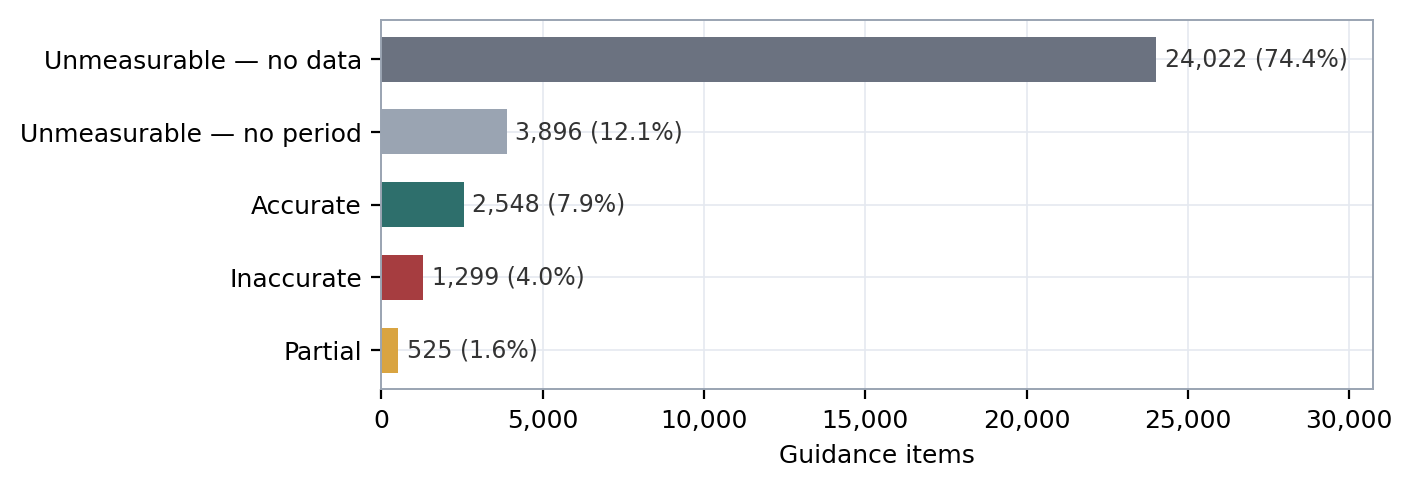
| UNMEASURABLE — NO DATA | No reported data maps cleanly to the guided quantity | 24,022 | 74.4% |
| UNMEASURABLE — NO PERIOD | Forecast period could not be pinned to a reporting period | 3,896 | 12.1% |
Table 1Verdict taxonomy and overall distribution across 32,290 extracted guidance items.
The headline accuracy rate is defined over measurable items only: (ACCURATE + PARTIAL) / (ACCURATE + PARTIAL + INACCURATE). The 4,372 measurable items yield the overall accuracy rate of 70.3% (Wilson 95% CI: 68.9–71.6). Treating PARTIAL verdicts as half-credit instead would lower the figure to 64.3%, so results should be read as an upper-bound interpretation of “delivered.”
2.3The Measurability Problem
Only 13.5% of extracted guidance could be verified (95% CI: 13.2–13.9). This is itself a substantive finding rather than a mere data limitation: the large majority of what management says about the future is structured in ways that resist verification — soft language without a quantifiable referent (74.4% of items lack matchable data) or without a concrete time horizon (12.1%). Whether this reflects genuine business uncertainty or deliberate strategic vagueness is beyond the scope of this study, but the sheer scale of unverifiable commentary should temper how much analytical weight is placed on the average earnings-call statement.
3Results
3.1Overall Accuracy and Its Distribution
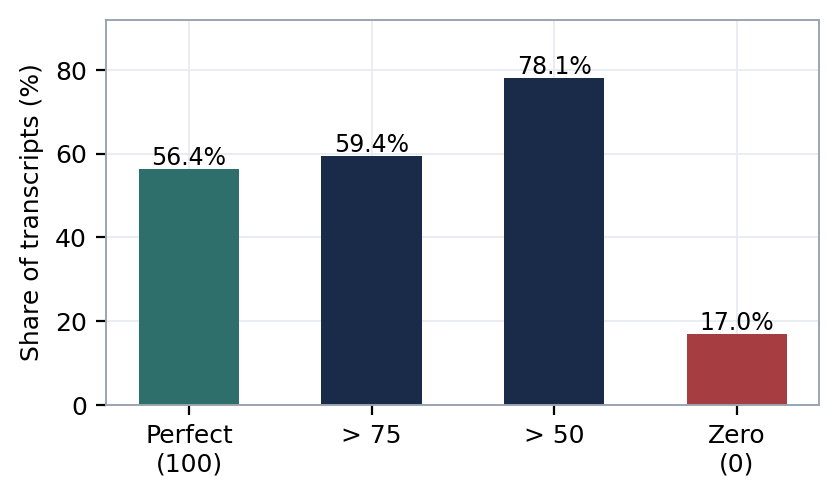
Across all measurable guidance, management delivered 70.3% of the time (95% CI: 68.9–71.6). The transcript-level distribution, however, is strongly bimodal rather than clustered around the mean. Among 2,097 transcripts with at least one measurable item, the mean accuracy score is 70.6 but the median is 100: 56.4% of transcripts show perfect realization of every measurable statement (95% CI: 54.3–58.5), while 17.0% score zero (95% CI: 15.4–18.6). Guidance credibility, in other words, is less a matter of degree than of kind — most calls are either fully delivered or fully missed.
3.2Accuracy by Fiscal Quarter
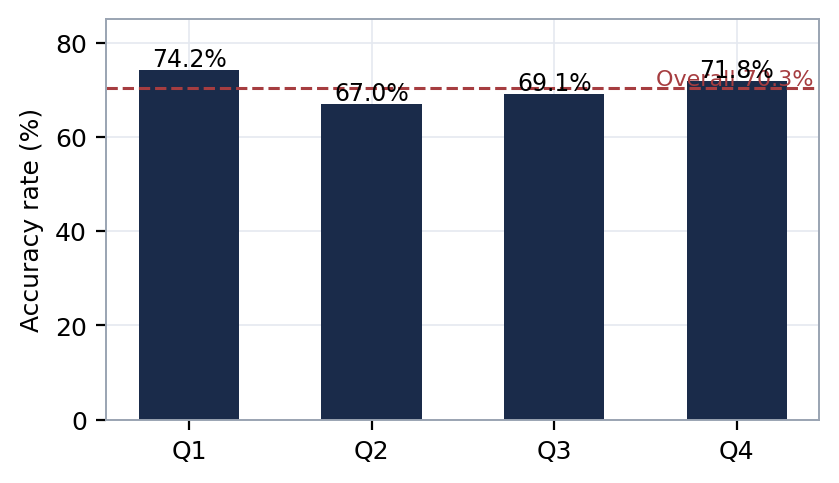
Accuracy varies modestly across the fiscal year: 74.2% in Q1 (95% CI: 71.4–76.8), dipping to 67.0% in Q2 (64.3–69.5), then 69.1% in Q3 (66.4–71.8), and recovering to 71.8% by Q4 (69.0–74.5). The Q1-to-Q2 decline is statistically significant (two-proportion z = 3.7, p < .001); the movements thereafter sit within overlapping intervals. One plausible mechanism: Q1 guidance skews toward near-term, within-year statements that management can see clearly, while mid-year calls carry more forward-year commentary issued under greater uncertainty. The data here cannot separate horizon effects from seasonal ones, so we flag the pattern without over-interpreting it.
3.3Precision Is Punished: Explicit vs. Qualitative Guidance
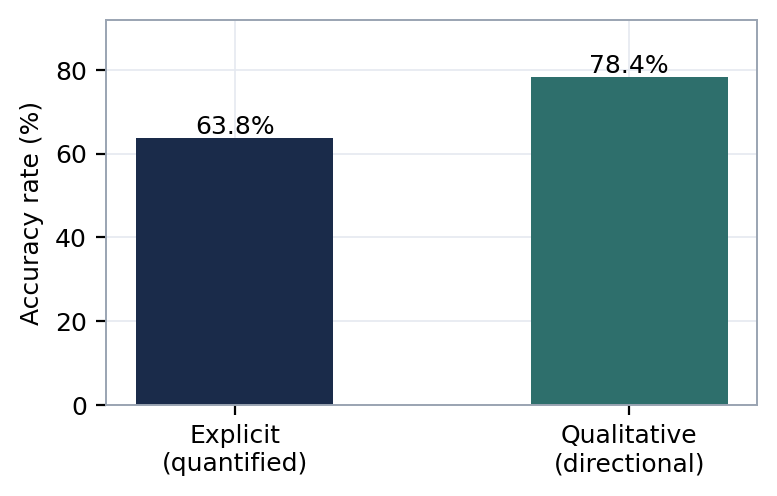
One of the sharper findings concerns statement precision. Explicit, quantified guidance is realized only 63.8% of the time (95% CI: 61.9–65.7; n = 2,435), while soft qualitative guidance is realized 78.4% of the time (95% CI: 76.5–80.2; n = 1,936) — a 14.6-point gap (z = 10.5, p < .001). This is partly mechanical: a directional claim (“revenue will grow”) has a far larger success region than a point estimate or a range, and qualitative claims that survive to measurability tend to be the easier ones to satisfy. But it carries a practical warning for analysts: the statements that look most usable as model inputs — the specific numbers — are precisely the ones that fail most often. The fine-grained direction data reinforces this: “specific range” guidance realized only 37.8% of the time and “specific target” guidance 0% (small n), while broad directional categories such as growth (71.7%), decline (73.6%), and improvement (82.8%) fared far better.
It is also notable that guidance about declines is slightly more reliable than guidance about growth (73.6% vs. 71.7%), and markedly more reliable than “stable/flat” claims (63.0–64.3%). When management warns of deterioration, it tends to be right; when it promises stability, skepticism is warranted.
3.4Accuracy by Metric
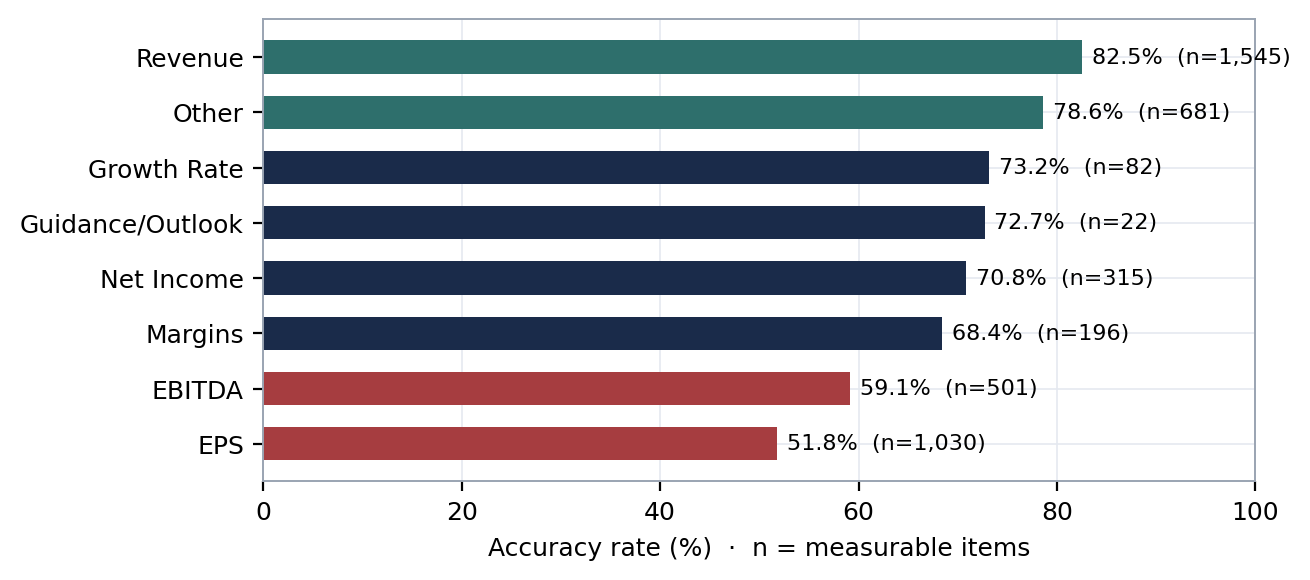
Not all numbers are guided equally well. Revenue guidance is the most reliable major category at 82.5% (95% CI: 80.6–84.3; n = 1,545), consistent with the intuition that top-line visibility (backlog, bookings, contracted revenue) is strongest. EPS guidance, at 51.8% (95% CI: 48.8–54.9; n = 1,030), is statistically indistinguishable from a coin flip — the interval includes 50% — unsurprising once one considers how many noisy layers (margins, taxes, share count, one-time items) sit between revenue and the bottom line. EBITDA (59.1%; CI: 54.7–63.3; n = 501) and margins (68.4%; CI: 61.6–74.5; n = 196) fall in between, following the same income-statement logic: reliability decays as one moves down the P&L. The 30.7-point revenue–EPS gap is the largest and most robust contrast in the study (z = 16.7, p < .001).
3.5Sector Patterns
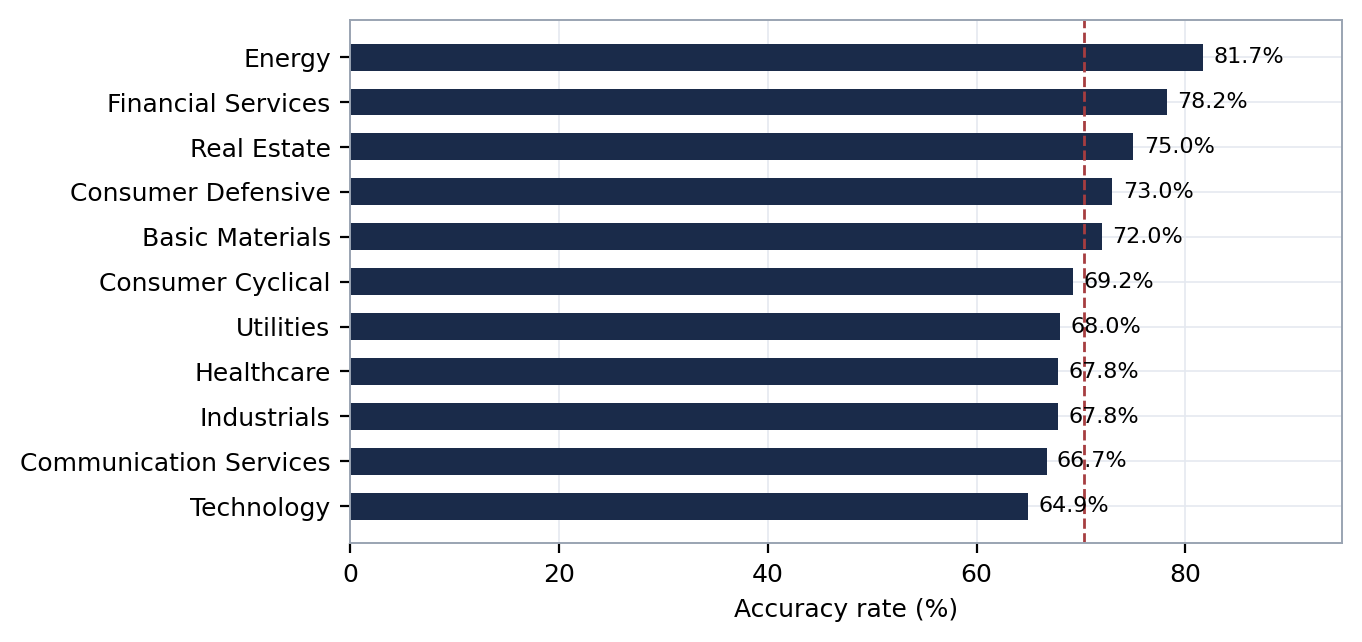
Sector-level accuracy spans nearly 17 points. Energy leads at 81.7% (95% CI: 76.4–86.1; n = 241) — plausibly because FY2016 followed the 2014–15 oil collapse, leaving managements guiding conservatively from a depressed base — followed by Financial Services (78.2%) and Real Estate (75.0%), sectors with contractual or spread-based revenue streams. Technology sits last at 64.9% (95% CI: 61.7–67.9; n = 914), with Communication Services (66.7%) close behind, consistent with shorter product cycles and demand that is genuinely harder to forecast. The Energy–Technology contrast survives formal testing (z = 5.0, p < .001), comfortably clearing a Bonferroni threshold for the 55 possible pairwise sector comparisons; smaller cells such as Utilities (n = 97; CI: 58.2–76.5) and Communication Services (n = 144; CI: 58.6–73.8) carry intervals too wide for their exact rankings to be taken literally. Industrials and Healthcare, the two largest guidance issuers in the corpus, both land at 67.8%.
3.6Company-Level Credibility
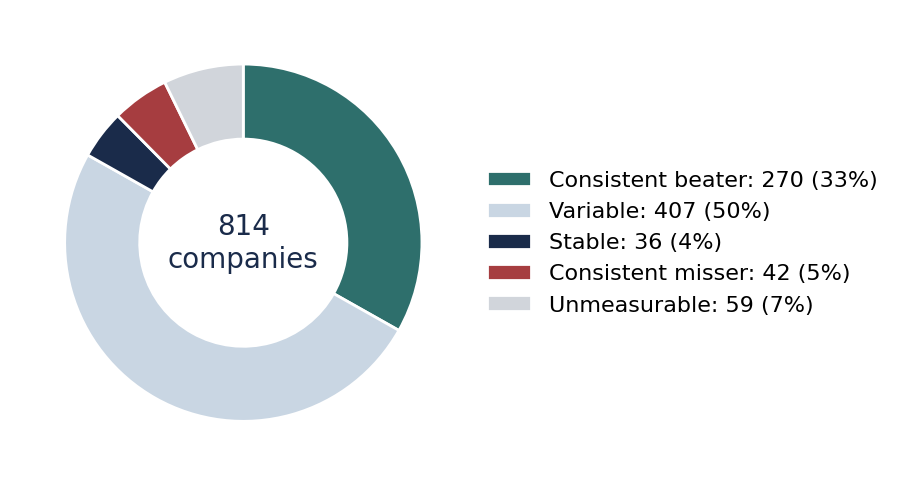
Aggregates conceal the most actionable pattern: guidance credibility is a persistent, firm-level trait. Classifying the 814 companies with sufficient coverage by the consistency of their quarterly accuracy scores yields 270 consistent beaters (33%), 42 consistent missers (5%), 36 stable performers, 407 variable performers (50%), and 59 firms with no measurable guidance at all.
Among firms with at least eight measurable items, a number delivered on every single verifiable statement in FY2016 — including MasTec (MTZ, 19/19), Extreme Networks (EXTR, 14/14), Nucor (NUE, 12/12), Cheniere Energy (LNG, 11/11), and Ulta (ULTA, 10/10). At the other extreme sit chronic missers such as Tetra Tech (TTEK, 0/8), Diebold (DBD, 7.1% of 14), and Boot Barn (BOOT, 11.1% of 9). For valuation work, this suggests a concrete practice: weight management guidance by the firm's own demonstrated track record rather than applying a uniform haircut. A guidance-derived growth assumption means something very different coming from a 100% realizer than from a firm that has missed every verifiable claim.
4Discussion
Three headline takeaways emerge. First, the average earnings call is mostly unverifiable talk: only one statement in seven can ever be graded. Second, among what can be graded, reliability is respectable in aggregate (70.3%) but collapses exactly where analysts lean hardest — explicit numbers, bottom-line metrics, and specific targets. Third, credibility is a firm-level characteristic with meaningful persistence, making guidance track records a cheap, data-derivable input to management-quality assessment. All three claims, however, are conditional on the quality of the LLM pipeline that produced the data — and that pipeline has identifiable strengths and identifiable defects. Section 5 assesses both directly, because an honest reading of the results requires knowing where the measurement instrument can and cannot be trusted.
5Pipeline Assessment: Strengths, Known Issues, and Open Questions
5.1What the Pipeline Does Well
- Scale with a uniform rubric. The pipeline applies one consistent extraction and grading standard across 3,166 transcripts and 32,290 statements — a task that would take a human team years and would suffer from analyst-to-analyst drift in what “counts” as guidance. Consistency at this scale is the core capability no manual approach can match.
- Face validity of aggregate patterns. The pipeline was never told that revenue should be more forecastable than EPS, that reliability should decay down the income statement, or that post-crash Energy managements should guide conservatively — yet it recovered all three patterns independently. When a measurement instrument reproduces well-understood structure it was not instructed to find, that is meaningful evidence the instrument is capturing something real.
- Conservative grading posture. Faced with 32,290 statements, the verdict model abstained on 86.5% of them rather than forcing a grade. Whatever the cost in sample size, this is the right failure direction: an over-eager grader that hallucinated verdicts would silently corrupt every downstream number, whereas abstention is visible and quantifiable.
- Structured, sliceable output. Because each item carries metric, direction, precision, period, and sector fields, the same dataset supports the quarter, metric, precision, sector, and firm-level analyses in Section 3 without re-processing. The design also makes the study cheaply repeatable on other fiscal years.
5.2Known Issues and Failure Modes
- (a) Taxonomy sprawl in extraction. The direction field, intended as a small controlled vocabulary, contains 629 distinct labels. The “range” concept alone appears as 27 variants (“range,” “specific range,” “guidance range,” “explicit range,” “range guidance,” and so on), and roughly 100 labels are variations on flat/stable. Some 624 labels have fewer than 500 items each, fragmenting 2,886 items into buckets too small to analyze. The root cause is that the extraction model generated free text where it should have been constrained to an enumerated schema. Consequence: direction-level results are trustworthy only for the top five or so categories; everything below that is noise.
- (b) Schema enforcement gaps. The output contains a misspelled verdict label (“UNMEASABLE_NO_DATA,” 2 items) and a literal “null” direction label (14 items). These are trivially small but diagnostic: model outputs were not validated against a schema before being written to the dataset, so nothing structurally prevents larger silent corruption of the same kind.
- (c) Suspiciously perfect categories. Roughly 95 direction labels grade at exactly 100% accuracy, including “guidance” (n = 152), “completion” (n = 133), and “increase” (n = 112). Labels describing vague or self-referential claims grade perfectly, while “specific target” grades 0-for-40. The pattern suggests verdict leniency is correlated with statement vagueness — some ACCURATE verdicts likely reflect targets that were nearly impossible to miss rather than genuine forecasting skill. The aggregate 70.3% figure therefore mixes forecast quality with target difficulty, and the two cannot be separated in the current design.
- (d) The measurability paradox. Explicit, quantified guidance was verifiable only 11.0% of the time (2,435 of 22,076 items), versus 19.0% for qualitative guidance (1,936 of 10,213; z = 19.4, p < .001). This is backwards: a stated number should be easier to check than a directional remark. The most plausible explanation is mechanical failure in the verification stage — fiscal-versus-calendar period mapping errors, and guided quantities (bookings, backlog, same-store sales, constant-currency growth, segment-level figures, non-GAAP measures) that simply do not exist in the standardized fundamentals dataset used for checking. This materially weakens the Section 2.3 interpretation: a large share of the 74.4% “no data” bucket likely reflects the pipeline's data coverage, not management vagueness, and the two explanations have opposite implications.
- (e) Reiteration double-counting. Companies routinely reaffirm the same full-year guidance on consecutive quarterly calls. The pipeline treats each reaffirmation as a new guidance item, so a single annual revenue target restated four times counts four times — overweighting reiterating firms in the aggregates and making item counts an unreliable measure of how much distinct guidance was actually issued.
- (f) No magnitude, no ground truth, no error bars. Verdicts are categorical, so missing EPS by one cent and missing by forty percent are graded identically. No hand-labeled audit sample exists, so extraction recall (guidance the model failed to find) and verdict precision (grades the model got wrong) are both unknown. Confidence intervals and significance tests have now been added for every rate reported in this paper (Appendix A): the headline contrasts — explicit versus qualitative, revenue versus EPS, Energy versus Technology — all survive at p < .001, and EPS accuracy is statistically indistinguishable from a coin flip. Intervals, however, cannot substitute for ground truth: extraction recall and verdict precision remain unmeasured, and firm-level cells are still small enough that individual company scores carry wide uncertainty.
- (g) Framing conventions that flatter the headline. Counting PARTIAL verdicts as successes lifts the headline rate from roughly 64% to 70.3%. Selection into measurability means the graded 13.5% is not a random sample of guidance. And the single-year FY2016 scope means every regime-dependent result — Energy conservatism above all — may not generalize.
5.3Agenda for Further Investigation
The issues above translate directly into a prioritized research agenda. Items 1–3 are validation work that should precede any extension of the findings; items 4–8 extend the analysis itself.
- Hand-audit the pipeline (highest priority). Manually grade a stratified sample of 200–300 items — spanning verdict types, metrics, and precision levels — to estimate extraction recall and verdict precision, and publish the resulting confusion matrix. Every other number in this paper inherits its error bars from this unknown; until it is measured, the headline 70.3% should be quoted with an asterisk.
- Constrain the output schema and re-run. Replace free-text direction and verdict fields with enforced enumerations (JSON-schema-validated outputs), collapse the 629 direction labels to roughly ten, and re-process the corpus. If the headline results are robust, they should survive the cleanup; if they move materially, the current version was measuring taxonomy noise.
- Diagnose the measurability paradox. Sample explicit items graded “no data” and classify why verification failed: period-mapping error, metric absent from the fundamentals dataset, or definitional mismatch. Then expand the verification layer with segment, KPI, and non-GAAP data. If explicit measurability can be raised from 11% toward 30–40%, the study's most-quoted numbers would rest on a several-fold larger and less biased sample.
- Deduplicate and track guidance revisions. Link items referring to the same underlying target across quarters, count each target once, and treat the revision path itself (raise, lower, reaffirm) as a signal — there is good reason to expect the sequence of revisions to be more informative than any single statement.
- Score magnitude, not just direction. For explicit items, compute percentage error against the guided value or range. This converts a hit-rate study into a calibration study — how far off management is, and whether misses skew optimistic — which is the more decision-relevant quantity for modeling.
- Extend longitudinally (FY2017 onward). Test whether the beater/misser classification persists year over year via transition matrices. Persistence is the entire practical value of the firm-level result; without a second year it is an untested hypothesis.
- Test predictive value. The economically interesting question: does a firm's trailing guidance track record predict future guidance accuracy, earnings surprises, or subsequent returns? If yes, the credibility score becomes a usable input to valuation and screening; if no, it is descriptive history.
- Benchmark against the street. Compare management guidance accuracy to analyst consensus accuracy for the same metrics and periods. “70.3%” has no natural interpretation in isolation; whether management is better or worse informed than its own analysts is the comparison that gives the number meaning.
6Conclusion
Management guidance occupies a strange epistemic position in equity analysis: universally consumed, rarely audited. Auditing 32,290 forward-looking statements from FY2016 earnings calls, we find that companies deliver on roughly seven of every ten verifiable claims — but this average conceals sharp and exploitable structure. Revenue promises are kept; EPS promises often are not. Vague optimism is usually vindicated; precise targets frequently fail. And most importantly, delivering on guidance appears to be a persistent firm-level trait. These findings come with the honest caveat that the measurement instrument is itself a model with documented defects — an unconstrained output taxonomy, an unexplained measurability gap, and no ground-truth audit — and Section 5 lays out the validation work required before the numbers should be treated as settled. What the study demonstrates unambiguously is the method: guidance can now be audited at corpus scale, and for the analyst the implication is direct — before letting a management team's outlook anchor a model, check whether that team has a habit of telling the truth about the future.
AAppendix — Confidence Intervals for All Reported Rates
Wilson 95% score intervals for every accuracy rate reported in Sections 2–3. A success is a verdict of ACCURATE or PARTIAL; n is the number of measurable items in the slice. Key two-proportion contrasts: qualitative vs. explicit z = 10.5; Revenue vs. EPS z = 16.7; Energy vs. Technology z = 5.0; Q1 vs. Q2 z = 3.7 (all p < .001).
| Slice | Successes (k) | n | Accuracy (95% CI) |
|---|---|---|---|
| Overall | |||
| Overall (all measurable items) | 3,073 | 4,372 | 70.3% (68.9 – 71.6) |
| By fiscal quarter | |||
| Q1 | 743 | 1,002 | 74.2% (71.4 – 76.8) |
| Q2 | 825 | 1,232 | 67.0% (64.3 – 69.5) |
| Q3 | 779 | 1,127 | 69.1% (66.4 – 71.8) |
| Q4 | 726 | 1,011 | 71.8% (69.0 – 74.5) |
| By statement precision | |||
| Explicit (quantified) | 1,554 | 2,435 | 63.8% (61.9 – 65.7) |
| Qualitative (directional) | 1,518 | 1,936 | 78.4% (76.5 – 80.2) |
| By metric category | |||
| Revenue | 1,275 | 1,545 | 82.5% (80.6 – 84.3) |
| Other | 535 | 681 | 78.6% (75.3 – 81.5) |
| Growth Rate | 60 | 82 | 73.2% (62.7 – 81.6) |
| Net Income | 223 | 315 | 70.8% (65.5 – 75.5) |
| Margins | 134 | 196 | 68.4% (61.6 – 74.5) |
| EBITDA | 296 | 501 | 59.1% (54.7 – 63.3) |
| EPS | 534 | 1,030 | 51.8% (48.8 – 54.9) |
| By sector | |||
| Energy | 197 | 241 | 81.7% (76.4 – 86.1) |
| Financial Services | 448 | 573 | 78.2% (74.6 – 81.4) |
| Real Estate | 189 | 252 | 75.0% (69.3 – 79.9) |
| Consumer Defensive | 135 | 185 | 73.0% (66.2 – 78.9) |
| Basic Materials | 144 | 200 | 72.0% (65.4 – 77.8) |
| Consumer Cyclical | 362 | 523 | 69.2% (65.1 – 73.0) |
| Utilities | 66 | 97 | 68.0% (58.2 – 76.5) |
| Industrials | 479 | 706 | 67.8% (64.3 – 71.2) |
| Healthcare | 364 | 537 | 67.8% (63.7 – 71.6) |
| Communication Services | 96 | 144 | 66.7% (58.6 – 73.8) |
| Technology | 593 | 914 | 64.9% (61.7 – 67.9) |
Table A1Accuracy rates with Wilson 95% confidence intervals across all reported slices.
Transcripts and fundamentals sourced from Financial Modeling Prep (FMP). Extraction and verification performed with Anthropic Claude via the Batch API to reduce repetitive workload. Analysis dataset generated May 21, 2026. All accuracy rates computed over measurable items as (ACCURATE + PARTIAL) / measurable. Confidence intervals are 95% Wilson score intervals; contrasts are two-proportion z-tests. Author: Tim Elrom, ValuFlow Research.
This document is a research exercise and does not constitute investment advice.